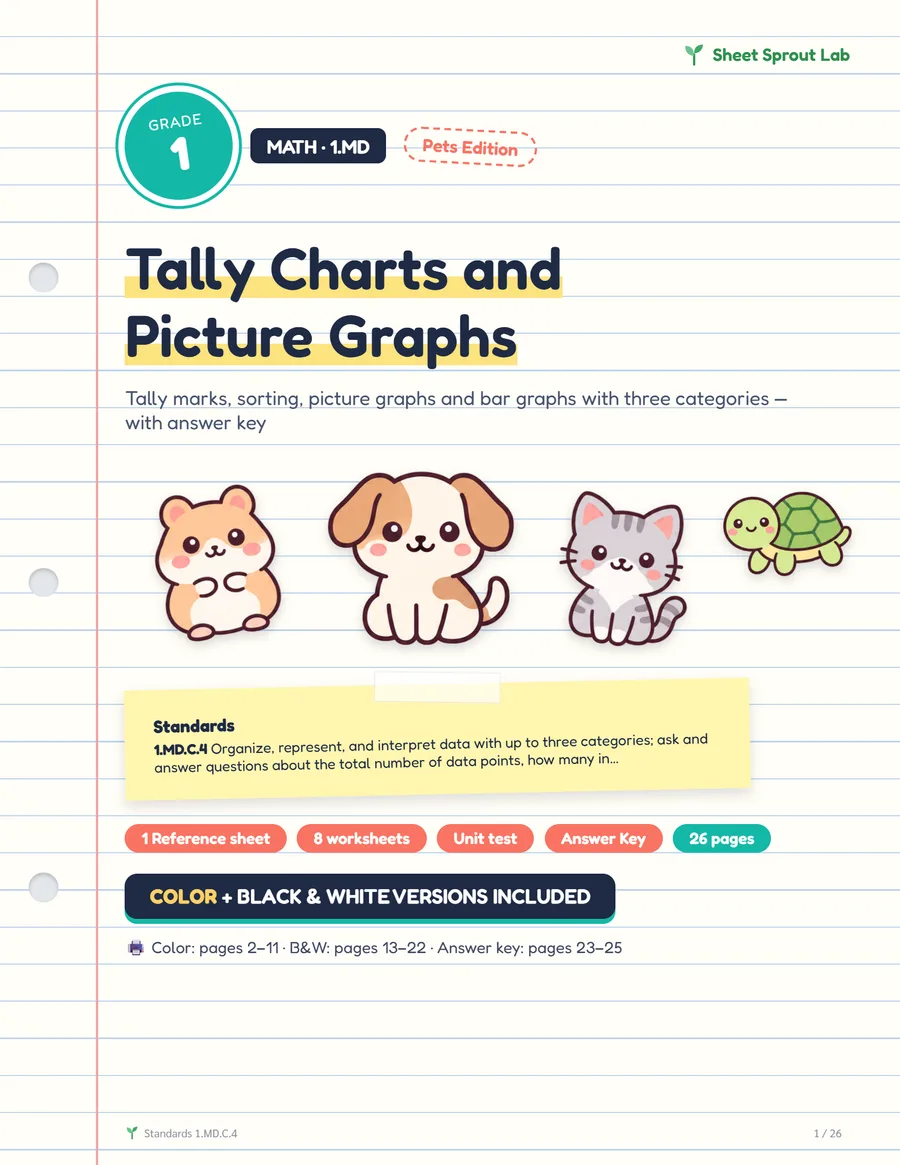
Tally Charts and Picture Graphs
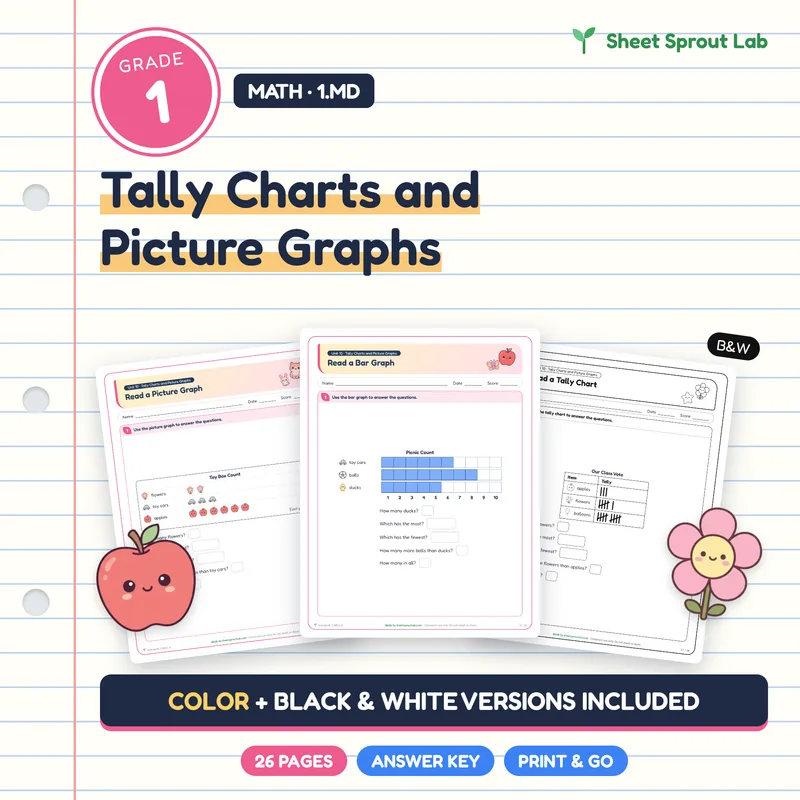
Tally marks, tally charts, picture graphs and bar graphs with three categories. Kids count, sort, make their own graphs and answer how many, how many more and how many in all.
A free printable with 3 of the 10 worksheets, in color and black & white, with the answer key.
- 9 worksheets + a tally and graphing reference page
- Tally charts, picture graphs and bar graphs
- How many, most, fewest, how many more and in all — answer key included
- Grade
- Grade 1
- Full set
- 10 worksheets in color, the same 10 in black & white, answer key · 26 pages
- Format
- PDF, US Letter (8.5 × 11 in)
- Standards
1.MD.C.4Organize, represent, and interpret data with up to three categories; ask and answer questions about the total number of data points, how many in each category, and how many more or less are in one category than in another.
The full set is on its way. Try the free sample with your class now. Leave your email when you download and we'll tell you when new worksheets are ready.
What's inside
- Tally Charts and Picture Graphs
- Count the Tally Marks
- Make Tally Marks
- Sort and Tally
- Read a Tally Chart
- Read a Picture Graph
- Read a Bar Graph
- Make a Bar Graph
- True or False?
- Assessment
Every worksheet comes in color and in black & white, with an answer key at the end.
How to use these math worksheets
Use the reference page to teach or review, then pick the worksheets that fit your lesson. They work for small groups, morning work, centers and homework. The last page is a short assessment.
Skills practiced
More practice: first grade measurement, time & money worksheets · all first grade math worksheets
Reviews
No reviews yet. Tried the free sample or the full set with your class? Your review helps other teachers and parents.